Jacksonville Jaguars vs Chicago Bears Match Player Stats
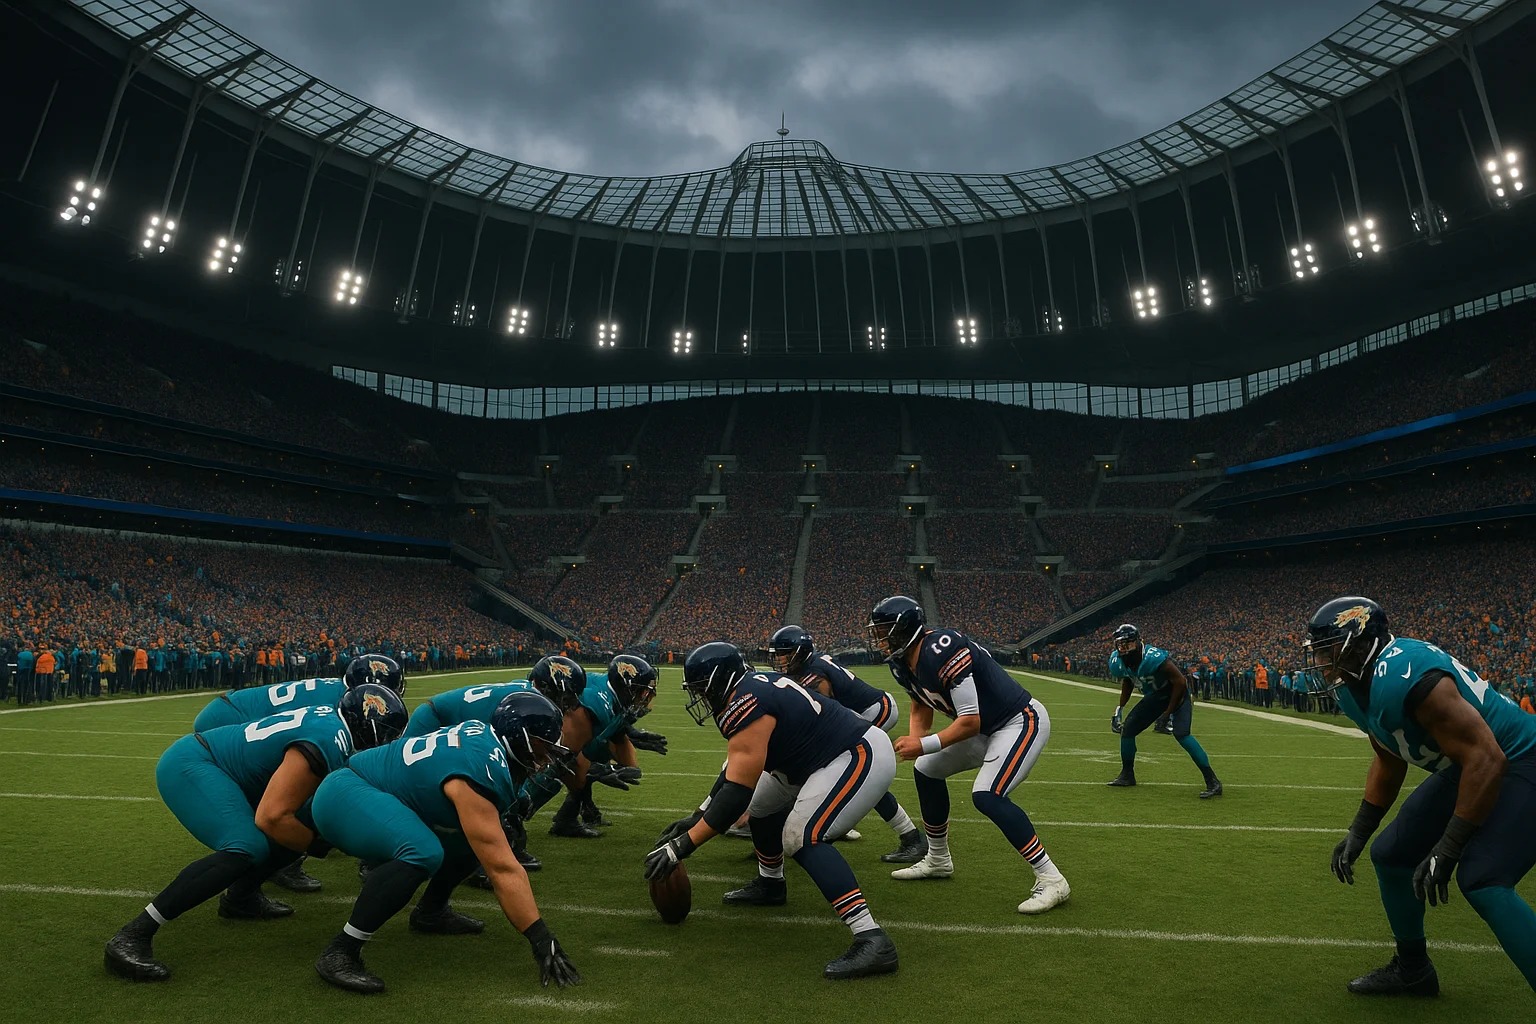
In an international showcase game at Tottenham Hotspur Stadium in London, the Chicago Bears outclassed the Jacksonville Jaguars with a 35-16 victory on October 13, 2024. The game attracted over 61,000 spectators and presented a matchup between two teams on very different seasonal trajectories.
Chicago came into the game at 3-2 and left with a stronger 4-2 record. Jacksonville, on the other hand, dropped to 1-5, raising questions about their offensive cohesion and defensive discipline.
The Bears used a highly efficient game plan to dismantle the Jaguars. They converted every red zone opportunity into points and made crucial defensive stops at key moments. Although Jacksonville struck first with a field goal in the opening quarter, the Bears stormed back with a 14-point second quarter and never relinquished control.
Final Score by Quarter
| Quarter | Jacksonville Jaguars | Chicago Bears |
|---|---|---|
| 1st | 3 | 0 |
| 2nd | 0 | 14 |
| 3rd | 7 | 7 |
| 4th | 6 | 14 |
| Final | 16 | 35 |
The numbers show a familiar story: Jacksonville starting strong but failing to sustain momentum, while Chicago built rhythm and finished strong.
What Does the Team Performance Reveal?
A closer look at the full team statistics gives deeper insight into where the game was won and lost. While total yardage was relatively close, Chicago excelled in execution, third-down conversions, and discipline. Jacksonville suffered from penalties and missed opportunities on third downs.
Full Team Stats Comparison
| Category | Jaguars (JAX) | Bears (CHI) |
|---|---|---|
| Total Yards | 278 | 373 |
| Turnovers | 2 | 1 |
| First Downs | 17 | 25 |
| 3rd Down Efficiency | 7/15 | 5/11 |
| 4th Down Efficiency | 2/2 | 1/1 |
| Red Zone Efficiency | 2/3 | 4/4 |
| Penalties | 8 for 43 yds | 2 for 10 yds |
| Time of Possession | 29:20 | 30:40 |
Despite having slightly less possession time, the Bears were more efficient with their drives, especially in the red zone, where they scored on every opportunity. Jacksonville’s two turnovers came at costly moments, halting any momentum they attempted to build in the second half.
Who Were the Game Leaders in Key Positions?
The quarterbacks were the focal points of this matchup. On one side, Chicago’s Caleb Williams showed composure beyond his years, while Jacksonville’s Trevor Lawrence delivered solid numbers but fell short in critical moments.
Quarterback Comparison
| Player | Comp/Att | Yards | TDs | INTs | Completion % |
|---|---|---|---|---|---|
| Caleb Williams (CHI) | 23/29 | 226 | 4 | 1 | 79.3% |
| Trevor Lawrence (JAX) | 23/35 | 234 | 2 | 1 | 65.7% |
Williams was more efficient, particularly in the red zone, where he converted two scoring drives with passes to tight end Cole Kmet. Lawrence had slightly more yardage but was sacked and intercepted during key drives.
Rushing Leaders
| Player | Team | Carries | Yards | TDs | Avg YPC |
|---|---|---|---|---|---|
| D’Andre Swift | CHI | 17 | 91 | 1 | 5.4 |
| D’Ernest Johnson | JAX | 6 | 28 | 0 | 4.7 |
Swift controlled the ground game effectively, extending drives and eating up valuable clock time in the second half.
Receiving Leaders
| Player | Team | Receptions | Yards | TDs |
|---|---|---|---|---|
| Evan Engram | JAX | 10 | 102 | 0 |
| Cole Kmet | CHI | 5 | 70 | 2 |
Engram was Lawrence’s most reliable target, moving the chains consistently, but it was Kmet who made the most of his chances in the red zone.
How Did the Defense Shape the Game Outcome?
Both defenses had standout moments, but Chicago’s unit was more effective in creating pressure and limiting explosive plays. Jacksonville had strong individual efforts but struggled to contain the Bears’ multi-dimensional offense.
Defensive Leaders
| Player | Team | Total Tackles | Solo | Sacks | INT |
|---|---|---|---|---|---|
| Ventrell Miller | JAX | 10 | 8 | 0 | 0 |
| Jaylon Jones | CHI | 10 | 9 | 0 | 0 |
| Roy Robertson-Harris | JAX | — | — | 1 | 0 |
| DeMarcus Walker | CHI | — | — | 1 | 0 |
While Jacksonville’s Ventrell Miller led all players in tackles, it was the pressure from Chicago’s defensive line—especially in key third-down situations, that changed the tone of the game.
What Does the Historical Head-to-Head Record Tell Us?
Chicago and Jacksonville have met 9 times in regular season history, with the Bears leading the series 6–3. Most of those victories have come in dominant fashion, including several blowouts in the early 2010s.
Head-to-Head Record Overview
| Result Category | Chicago Bears | Jacksonville Jaguars |
|---|---|---|
| Games Played | 9 | 9 |
| Wins | 6 | 3 |
| Total Points Scored | 245 | 149 |
| Average Points/Game | 27.2 | 16.6 |
In terms of scoring, the Bears average over 10 points more per game in these matchups. They’ve also demonstrated dominance in the rushing game, with a much higher TD-to-attempt ratio.
How Have the Teams Performed All-Time in Passing and Rushing?
The Bears, with a much longer NFL history, have established dominance in cumulative stats. However, Jacksonville’s shorter history means that per-game efficiency is a better metric to assess.
All-Time Regular Season Passing Stats (1995–2024 Head-to-Head)
| Team | Completions | Yards | TDs | INTs | Sacks |
|---|---|---|---|---|---|
| CHI | 189 | 2044 | 14 | 5 | 13 |
| JAX | 200 | 1847 | 15 | 14 | 19 |
All-Time Head-to-Head Rushing Stats
| Team | Attempts | Yards | Yards/Carry | Rushing TDs |
|---|---|---|---|---|
| CHI | 269 | 1139 | 4.2 | 9 |
| JAX | 201 | 839 | 4.2 | 2 |
The Bears have found more consistency on the ground, scoring 7 more rushing touchdowns in head-to-head matchups.
How Did Special Teams and Penalties Impact the Game?
Special teams played a supporting role, but field position and penalty discipline significantly affected momentum, particularly for Jacksonville.
Special Teams & Discipline Comparison
| Metric | Jaguars (JAX) | Bears (CHI) |
|---|---|---|
| Field Goals Made | 1 | 1 |
| Penalties (Yards) | 8 (43 yds) | 2 (10 yds) |
| Punting Avg (Yards) | 44.6 | 44.5 |
| Kick Return Avg (Yds) | 25.2 | 25.0 |
While the punting averages were nearly identical, Jacksonville’s 8 penalties disrupted offensive drives and handed momentum to Chicago on multiple occasions.
What Were the Key Takeaways from the Jaguars vs Bears Match Player Stats?
The 2024 matchup between the Jacksonville Jaguars and Chicago Bears highlighted the importance of red zone efficiency, ball control, and quarterback performance under pressure. Despite similar passing yardage, the Bears’ ability to capitalize on every scoring opportunity and minimize mistakes was the decisive factor.
Trevor Lawrence put up decent numbers but could not overcome two turnovers and stalled drives. Caleb Williams’ four-touchdown performance further solidified his standing as one of the top emerging QBs in the league.
With this win, the Bears are gaining momentum in the NFC, while the Jaguars are facing mounting pressure to turn their season around.
FAQs About Jacksonville Jaguars vs Chicago Bears Player Stats
Who was the top performer in the Jaguars vs Bears 2024 game?
Caleb Williams threw four touchdowns, making him the most impactful player on the field.
How efficient were the Bears in the red zone?
The Bears were a perfect 4-for-4 in the red zone, converting every opportunity into a touchdown.
How do the teams compare historically?
Chicago leads the series 6–3 and has outscored Jacksonville significantly over the years.
Who led the Jaguars in receiving yards?
Tight end Evan Engram led with 102 yards on 10 receptions.
What were the key stats that decided the game?
Red zone efficiency, turnovers, and penalty yards were the most impactful.
Has Jacksonville beaten the Bears recently?
The Jaguars’ last win over Chicago was in 2016, by a single point.
Which defense played better?
Chicago’s defense created more pressure and committed fewer penalties, leading to a more disciplined and effective performance.